Bonjour,
je travaille le projet d’évaluation avec chartjs (sans extension), je fais le code sans probleme mais pas simple et clair. j’ai besoin de vos avis. je te les montre.
( I work the evaluation project with chart js (without extension), I do the code without problem but not simple and clear. I need your opinion. I show them to you. )
Controller:
public function actionStats()
{
    /**
     * Graphique de nombre Note : A, B, C = $pie
     */
    $pie = YII::$app->db->createCommand('SELECT * ,COUNT(note1)AS total FROM `evalsal` where note1=:note1  GROUP BY note1 and user_id');

    $ta = $pie->bindValue(':note1', 'A')->queryAll();
    $tb = $pie->bindValue(':note1', 'B')->queryAll();
    $tc = $pie->bindValue(':note1', 'C')->queryAll();


    /**
     * Graphique de nombre facture = $line1
     */
    $line1 = YII::$app->db->createCommand('SELECT MONTH(createdat)AS mois, SUM(fact)AS total where MONTH(createdat)=:mois FROM evalsal   GROUP BY mois');

    $Factjanv = $line1->bindValue(':mois', 1)->queryAll();
    $Factfev = $line1->bindValue(':mois', 2)->queryAll();
    $Factmar = $line1->bindValue(':mois', 3)->queryAll();
    $Factavr = $line1->bindValue(':mois', 4)->queryAll();
    $Factmai = $line1->bindValue(':mois', 5)->queryAll();
    $Factjui = $line1->bindValue(':mois', 6)->queryAll();
    $Factjuil = $line1->bindValue(':mois', 7)->queryAll();
    $Factaou = $line1->bindValue(':mois', 8)->queryAll();
    $Factsep = $line1->bindValue(':mois', 9)->queryAll();
    $Factoct = $line1->bindValue(':mois', 10)->queryAll();
    $Factnov = $line1->bindValue(':mois', 11)->queryAll();
    $Factdec = $line1->bindValue(':mois', 12)->queryAll();

/**
 * Graphique de nombre retard = $line2
 */
    $line2 = YII::$app->db->createCommand('SELECT MONTH(createdat)AS mois, SUM(retard)AS total FROM evalsal where MONTH(createdat)=:mois GROUP BY mois');

    $Retjanv = $line2->bindValue(':mois', 1)->queryAll();
    $Retfev = $line2->bindValue(':mois', 2)->queryAll();
    $Retmar = $line2->bindValue(':mois', 3)->queryAll();
    $Retavr = $line2->bindValue(':mois', 4)->queryAll();
    $Retmai = $line2->bindValue(':mois', 5)->queryAll();
    $Retjui = $line2->bindValue(':mois', 6)->queryAll();
    $Retjuil = $line2->bindValue(':mois', 7)->queryAll();
    $Retaou = $line2->bindValue(':mois', 8)->queryAll();
    $Retsep = $line2->bindValue(':mois', 9)->queryAll();
    $Retoct = $line2->bindValue(':mois', 10)->queryAll();
    $Retnov = $line2->bindValue(':mois', 11)->queryAll();
    $Retdec = $line2->bindValue(':mois', 12)->queryAll();


    return $this->render('_stats',  compact("ta","tb", "tc",
        "Factjanv","Factfev","Factmar","Factavr","Factmai","Factjui","Factjuil","Factaou","Factsep","Factoct","Factnov","Factdec",
        "Retjanv","Retfev","Retmar","Retavr", "Retmai","Retjui","Retjuil","Retaou","Retsep","Retoct","Retnov","Retdec")

        ) ;

}
_stats.php:
<?php /* @var $this yii\web\View */ /* @var $model backend\models\EvalsalStats */ $this->params['breadcrumbs'][] = 'Stats'; ?>
<?= $this->render('_sibebar') ?>
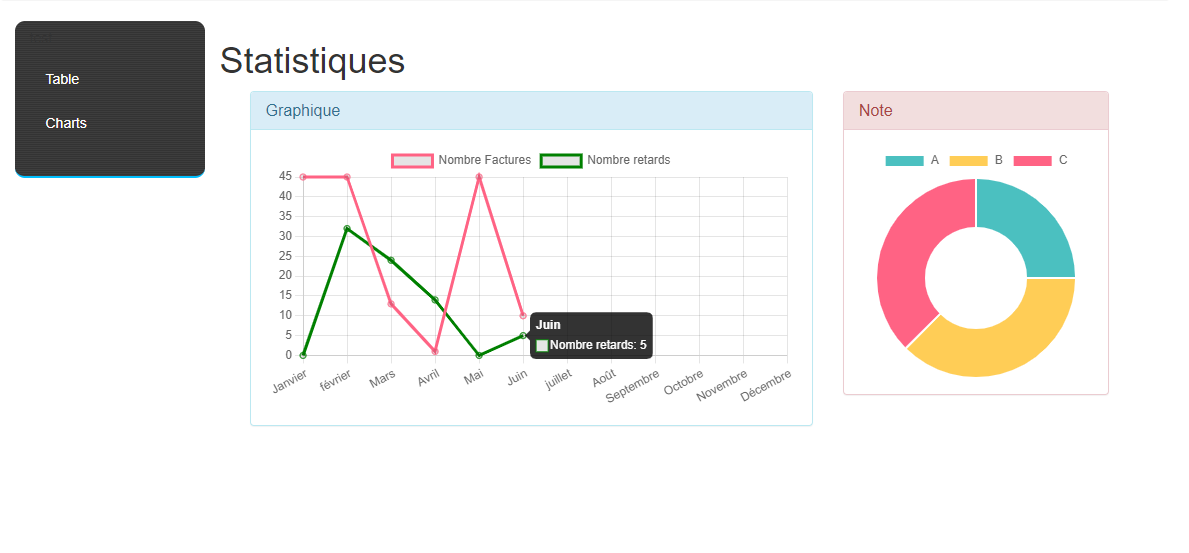
Statistiques
Graphique
        <div class="col-md-4">
            <div class="panel panel-danger">
                <div class="panel-heading">
                    <h3 class="panel-title">Note</h3>
                </div>
                <div class="panel-body">
                    <div class="chart2">
                        <canvas id="myChart2" style="height:60vh"></canvas>
                    </div>
                </div>
                <!-- /.panel-body -->
            </div>
        </div>
        <div class="col-md-4">
            <canvas id="myChart2" > </canvas>
        </div>
    </div>

<script>
    const evalsal = document.getElementById('myChart');
    const myChart = new Chart(evalsal, {
        type: 'line',
        data: {
            labels:['Janvier', 'février', 'Mars', 'Avril', 'Mai', 'Juin', 'juillet', 'Août', 'Septembre', 'Octobre','Novembre','Décembre'],
            datasets: [{
                label: 'Nombre Factures',

                data: [ <?php
                    foreach ($Factjanv as $evalsal){
                    echo $evalsal["total"];
                }?>,<?php foreach ($Factfev as $evalsal){
                    echo $evalsal["total"];
                }?>,<?php foreach ($Factmar as $evalsal){
                    echo $evalsal["total"];
                }?>,<?php foreach ($Factavr as $evalsal){
                    echo $evalsal["total"];
                }?>,<?php foreach ($Factmai as $evalsal){
                    echo $evalsal["total"];
                }?>,<?php foreach ($Factjui as $evalsal){
                    echo $evalsal["total"];
                }?>,<?php foreach ($Factjuil as $evalsal){
                    echo $evalsal["total"];
                }?>,<?php foreach ($Factaou as $evalsal){
                    echo $evalsal["total"];
                }?>,<?php foreach ($Factsep as $evalsal){
                    echo $evalsal["total"];
                }?>,<?php foreach ($Factoct as $evalsal){
                    echo $evalsal["total"];
                }?>,<?php foreach ($Factnov as $evalsal){
                    echo $evalsal["total"];
                }?>,<?php foreach ($Factdec as $evalsal){
                    echo $evalsal["total"];
                }?>,],
                fill:false,
                borderColor: [
                    'rgb(255, 99, 132, 1)',
                ],

            },
                {
                    label: 'Nombre retards',
                    data: [<?php foreach ($Retjanv as $evalsal){
                        echo $evalsal["total"];
                    }?>,<?php foreach ($Retfev as $evalsal){
                        echo $evalsal["total"];
                    }?>,<?php foreach ($Retmar as $evalsal){
                        echo $evalsal["total"];
                    }?>,<?php foreach ($Retavr as $evalsal){
                        echo $evalsal["total"];
                    }?>,<?php foreach ($Retmai as $evalsal){
                        echo $evalsal["total"];
                    }?>,<?php foreach ($Retjui as $evalsal){
                        echo $evalsal["total"];
                    }?>,<?php foreach ($Retjuil as $evalsal){
                        echo $evalsal["total"];
                    }?>,<?php foreach ($Retaou as $evalsal){
                        echo $evalsal["total"];
                    }?>,<?php foreach ($Retsep as $evalsal){
                        echo $evalsal["total"];
                    }?>,<?php foreach ($Retoct as $evalsal){
                        echo $evalsal["total"];
                    }?>,<?php foreach ($Retnov as $evalsal){
                        echo $evalsal["total"];
                    }?>,<?php foreach ($Retdec as $evalsal){
                        echo $evalsal["total"];
                    }?>,],
                    fill:false,
                    borderColor: [
                        'rgb(0, 128, 0, 2)',
                    ],

                }]
        },
        options: {
            scales: {
                y: {
                    beginAtZero: true
                }
            }
        }
    });
    const total = document.getElementById('myChart2');
    const myChart2 = new Chart(total, {
        type: 'doughnut',
        data: {
            labels: ['A', 'B','C'],
            datasets: [{
                label: 'My First Dataset',
                data: [<?php foreach ($ta as $evalsal){
                    echo $evalsal["total"];
                }?>,<?php foreach ($tb as $evalsal){
                    echo $evalsal["total"];
                }?>,<?php foreach ($tc as $evalsal){
                    echo $evalsal["total"];
                }?>,],
                backgroundColor: [
                    'rgb(75, 192, 192)',
                    'rgb(255, 205, 86)',
                    'rgb(255, 99, 132)',
                ],

            },
            ]
        },

    });
</script>

</div>
resultat: