skinner
June 20, 2011, 7:56pm
1
The Yii Debug Toolbar is a configurable set of panels that display various
debug information about the current request/response and when clicked, display
more details about the panel’s content.
It is a ported to PHP famous Django Debug Toolbar.
Currently, the following panels have been written and are working:
Installation
Download source from GitHub.
Extract the yii-debug-toolbar from archive under protected/extensions.
Usage and Configuration
For use yii-debug-toolbar need to specify new route in log component:
 'log'=>array(

        'class'=>'CLogRouter',

        'routes'=>array(

            array(

                'class'=>'ext.yii-debug-toolbar.YiiDebugToolbarRoute',

                'ipFilters'=>array('127.0.0.1','192.168.1.215'),

            ),

        ),

    ),
Make sure your IP is listed in the ipFilters setting. If you are working locally this option not required.
TODOs and BUGS
See: https://github.com/malyshev/yii-debug-toolbar/issues
Working preview
imehesz
June 20, 2011, 8:50pm
2
hi,
this looks cool! why don’t you put it here http://www.yiiframework.com/extension
–iM
Skinner:
The Yii Debug Toolbar is a configurable set of panels that display various
debug information about the current request/response and when clicked, display
more details about the panel’s content.
It is a ported to PHP famous Django Debug Toolbar.
Currently, the following panels have been written and are working:
Installation
Download source from GitHub.
Extract the yii-debug-toolbar from archive under protected/extensions.
Usage and Configuration
For use yii-debug-toolbar need to specify new route in log component:
 'log'=>array(

        'class'=>'CLogRouter',

        'routes'=>array(

            array(

                'class'=>'ext.yii-debug-toolbar.YiiDebugToolbarRoute',

                'ipFilters'=>array('127.0.0.1','192.168.1.215'),

            ),

        ),

    ),
Make sure your IP is listed in the ipFilters setting. If you are working locally this option not required.
TODOs and BUGS
See: https://github.com/malyshev/yii-debug-toolbar/issues
Working preview
very cool extension, thanks a lot
skinner
June 21, 2011, 6:11am
4
I was trying submit my extension in Yii extension directory, but could not do it, because first need to introducing in our forum. Now I see I can do it. I hope my extension will be very useful for Yii community.
If any have some todo’s or bugs found please submit to project issue tracker on GitHub. Thanks a lot.
mentel
June 28, 2011, 12:52am
5
Very nice and good-looking extension
There’s a similar one: yiidebugtb.
skinner
September 22, 2011, 10:33am
6
Now is updated))
Added SQL syntax highlighting
Added highlighting of potentially inefficient queries
Miscellaneous fixes and UI enhancements
Thank for all for ideas and assistance
dckurushin
September 22, 2011, 9:22pm
7
skinner
September 26, 2011, 2:26pm
8
Hello guys.
Newest version on GitHub contains new debug panel. View rendering debug panel allows to see all info about rendered view files. I glad to get your feedbacks about how it works in your applications.
jeroen84
November 21, 2011, 10:46am
9
Hi Skinner,
I am trying to use Yii Debug Toolbar, but I dont see anything.
I downloaded the extension in /protected/extensions/
And my config is:
		'log'=>array(

        	'class'=>'CLogRouter',

        	'routes'=>array(

	            array(

    	            'class'=>'ext.yii-debug-toolbar.YiiDebugToolbarRoute',

        	        //If true, then after reloading the page will open the current panel

            	    'openLastPanel'=>true,

                	// Access is restricted by default to the localhost

	                'ipFilters'=>array('127.0.0.1','::1', '172.*.*.*'),

    	            //This is a list of paths to extra panels.

        	        'additionalPanels'=>array(

            	        'YiiDebugToolbarPanelExample', // add as last

                	    'prepend:YiiDebugToolbarPanelExample', // add as first

                	),

            	),

        	),

    	),
But it doesnt display any toolbar in my app… If I set a normal route like ‘class’=>‘CWebLogRoute’, I get the normal output at the bottom of the page.
skinner
December 2, 2011, 11:12am
10
Guys! Yii Debug Toolbar has updated! Check it now! )))
skinner
December 2, 2011, 11:15am
11
Hi Skinner,
I am trying to use Yii Debug Toolbar, but I dont see anything.
I downloaded the extension in /protected/extensions/
And my config is:
		'log'=>array(

        	'class'=>'CLogRouter',

        	'routes'=>array(

	            array(

    	            'class'=>'ext.yii-debug-toolbar.YiiDebugToolbarRoute',

        	        //If true, then after reloading the page will open the current panel

            	    'openLastPanel'=>true,

                	// Access is restricted by default to the localhost

	                'ipFilters'=>array('127.0.0.1','::1', '172.*.*.*'),

    	            //This is a list of paths to extra panels.

        	        'additionalPanels'=>array(

            	        'YiiDebugToolbarPanelExample', // add as last

                	    'prepend:YiiDebugToolbarPanelExample', // add as first

                	),

            	),

        	),

    	),
But it doesnt display any toolbar in my app… If I set a normal route like ‘class’=>‘CWebLogRoute’, I get the normal output at the bottom of the page.
Hey ) Use the latest version and config like that:
array(
‘class’=>‘ext.yii-debug-toolbar.YiiDebugToolbarRoute’,
// Access is restricted by default to the localhost
‘ipFilters’=>array(‘127.0.0.1’,’::1’, ‘172.*’),
),
Additional panels functionality it 3-rd party developed and I’m not sure is it works.
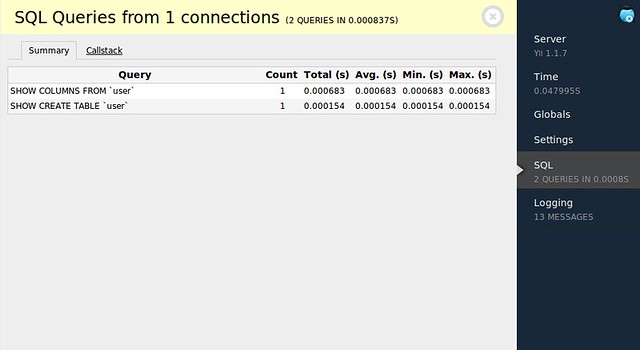
Hey man, very nice extension. Do you know why mine doesn’t show queries? Every thing else works as expected…
Is there some config I have to set up for the queries?
abennouna
March 15, 2012, 7:03am
14
Hey man, very nice extension. Do you know why mine doesn’t show queries? Every thing else works as expected…
Is there some config I have to set up for the queries?
In my case, I had this displayed:
so I just added to my config file
[font=“Courier New”]‘db’=>array(
‘connectionString’ => ‘mysql:host=localhost;dbname=myDB’,
‘emulatePrepare’ => true,
‘username’ => ‘myUsername’,
‘password’ => ‘myPwd’,
‘charset’ => ‘utf8’,
‘enableProfiling’=>true,
),[/font]
(I use a MySQL DB)
Btw, thanx skinner for this great extension
Hi Skinner,
This seems to be a very helpful extension. However I am not getting this toolbar working out.
I apologize for my "amateurism" but how can I see toolbar panels after configuring everything as documented?
Thanks in advance,
A.Miguel
kohpeiss
September 24, 2012, 9:49am
17
Hi,
where is the additionalPanels config gone?
Thx.
Thorsten
naduvko
April 25, 2013, 8:56am
18
Is there a way to disable it on specific view?
realtebo
August 22, 2013, 10:05am
19
I’ve just now added yii-debug-toolbar as git submodule, so it’s now in
protected/extensions/yii-debug-toolbar/yii-debug-toolbar
due to your folder config.
My config is:
// Debug toolbar

                'toolbar' => array(

                    'class'     => 'ext.yii-debug-toolbar.yii-debug-toolbar.YiiDebugToolbarRoute',

                    'ipFilters' => array('10.*.*.*', '192.168.*.*'),

                    'enabled'   => true,

                ),
And my IP is in range 196.168..
I modified the init function like this
    public function init()

    {

        $this->_startTime=microtime(true);


        parent::init();


        echo ($this->enabled ? "enabled" : "not enabled") . "<BR>";


        echo "Your ip: ".  Yii::app()->request->userHostAddress . "<BR>";


        echo ( ($this->allowIp(Yii::app()->request->userHostAddress)) ? "ip allowed" : "ip not allowed" ) . "<BR>";


        $this->enabled && $this->enabled = ($this->allowIp(Yii::app()->request->userHostAddress)

                && !Yii::app()->getRequest()->getIsAjaxRequest() && (Yii::app() instanceof CWebApplication));


        if ($this->enabled)

        {

            Yii::app()->attachEventHandler('onBeginRequest', array($this, 'onBeginRequest'));

            Yii::app()->attachEventHandler('onEndRequest', array($this, 'onEndRequest'));

            Yii::setPathOfAlias('yii-debug-toolbar', dirname(__FILE__));

            Yii::app()->setImport(array(

                'yii-debug-toolbar.*',

                'yii-debug-toolbar.components.*'

            ));

            $this->categories = '';

            $this->levels='';

        } else {

            echo "ARGH, NON ENABLED " . PHP_EOL;


        }

    }
To show where the problem come from. I got:
enabled

Your ip: 192.168.0.116

ip not allowed
realtebo
August 22, 2013, 10:23am
20
the problem is here:
 if (preg_match('/^[\d\.]*\*?$/', $filter)) {

                $filter = rtrim($filter, '*');

                if (strncmp($ip, $filter, strlen($filter)) === 0)

                {

                    return true;

                }

            }
So i Must explicit 192.168.0., 192.16.8.1. , … etc… annoyiing !
I’ll open an issue, and I’ll try to find a less restictive regexp …
EDIT: I found that 10.* or 192.168.* will work.