Hi everyone,
I thought I would announce my first contribution to the Yii community with a charting widget I have recently developed. I hope you find it useful!
CVisualizeWidget
Hi everyone,
I thought I would announce my first contribution to the Yii community with a charting widget I have recently developed. I hope you find it useful!
CVisualizeWidget
I don’t know if this will help anybody, but I updated the extension view to allow for use with dataProviders.
In your view:
$this->widget('application.extensions.cvisualizewidget.CVisualizeWidget',array(
'data'=>array(
'dataProvider'=>$dataProvider,
'headingField'=>'Job_Category',
'dataColumns'=>array(
'Value',
array(
'header'=>'Invoice',
'value'=>'$data["Total"]'
),
array(
'header'=>'Difference',
'value'=>'$data["Value"]-$data["Total"]',
)
),
),
'options' => array(
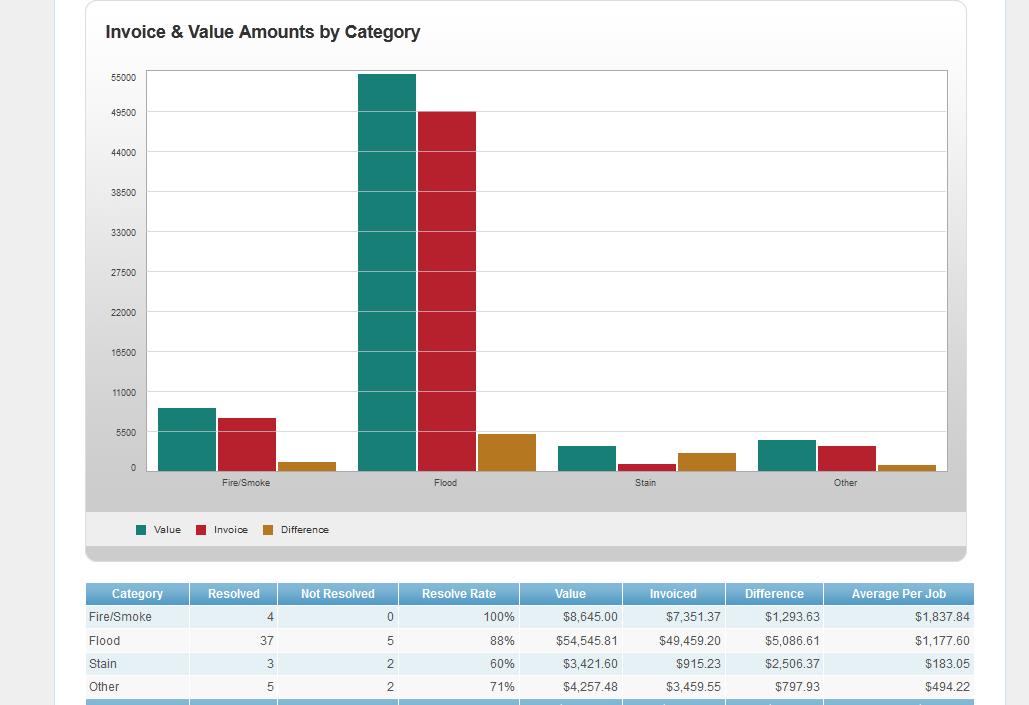
'title'=>'Invoice & Value Amounts by Region',
'type'=>'bar',
'parseDirection'=>'x',
)
));
and in the extension view:
<table id="<?php echo $this->tableID; ?>" class="visualize">

  <thead>

    <tr>

      <td></td>

	  <?php foreach($data['dataProvider']->data as $row=>$chartData) : ?>

		<th scope="col">

			<?php

				// x-axis labels

				echo CHtml::encode($chartData[$data['headingField']]);

			?>

		</th>

      <?php endforeach; ?>

    </tr>

  </thead>

  <tbody>

	<?php foreach($data['dataColumns'] as $column) : ?>

		<? if(is_array($column)): ?>

			<tr>

				<th scope="row">

					<?php

						// legend

						echo $column['header'];

					?>

				</th>

				<?php foreach($data['dataProvider']->data as $row=>$chartData) : ?>

					<td><?php echo (int) $this->evaluateExpression($column['value'], array('data'=>$chartData)); ?></td>

				<?php endforeach; ?>

			</tr>

		<? else : ?>

			<tr>

			  <th scope="row">

				<?php

					// legend

					echo $column;

				?>

			  </th>

			  <?php foreach($data['dataProvider']->data as $row=>$chartData) : ?>

				<td><?php echo (int)$chartData[$column]; ?></td>

			  <?php endforeach; ?>

			</tr>


		<? endif; ?>

    <?php endforeach; ?>

  </tbody>

</table>


<script type="text/javascript">

//<![CDATA[

jQuery(document).ready(function($)

{

	$('table#<?php echo $this->tableID; ?>').visualize({

		type:'<?php echo $this->type; ?>',

		<?php foreach(array_keys($options) as $opt) : ?>

		<?php echo $opt; ?>:<?php echo is_int($options[$opt]) ? (int)$options[$opt] : is_array($options[$opt]) ? CJSON::encode($options[$opt]) : '"'.$options[$opt].'"'; ?>,

		<?php endforeach; ?>

	});

});

//]]>

</script>
Example:
3216
Hello there,
Does anyone did a version using 2 axis ? I’ll try to do it, but if it exists, tell it to me ![]()